MARK III/4 Instruction and Maintenance Manual — Digital Edition · Part 7 · scan pages 75-100
Performance Testing and Electronic Alignment
Performance testing should be made at regularly scheduled intervals (every 150 hours or every month) to ensure that the recorder is performing within specifications.
These tests should also be performed whenever the recorder appears to be malfunctioning and following repairs to the equipment that may affect performance.
If the performance test is not successful, proceed to the applicable electronic alignment procedure.
It is important to clean and demagnetize the head and tape guiding components before performing the following steps.
7-1 GENERAL NOTICE↑ TOP
It is important to clean and demagnetize the head and tape guiding components before performing the test and alignment procedures.
The levels indicated in this section are at a 1 KHz frequency at the reference recording level of 250 nWb/m.
In the case of IEC equalization, the reference record level is 320 nWb/m that is 1.2 dB above 250 nWb/m.
Refer to Figure 7-10.
7-2 TEST TAPES↑ TOP
Test tapes are precisely recorded under controlled conditions and must be correctly handled and stored to retain accuracy.
Handle the test tapes as follows:
- Clean and demagnetize the head and tape guiding components before installing the test tape.
- Never store test tapes in areas of temperature or humidity extremes.
- Never run the test tapes on speeds other than a normal play run (never use the rewind or fast forward mode). This is further explained below.
During the alignment procedure, the rewind and fast forward modes should not be used.
After alignment, wind the tape completely on the takeup reel, interchange reels, thread the tape, and place the equipment in the play mode to wind the tape back on its original reel.
After extensive use, high frequency tones may drop as much as 2 dB.
In addition, flutter indication may rise even though actual flutter remains unchanged.
Flutter increase is caused by demagnetization of the recorded signal from repeated plays, tape deformation due to tape tension, changes in temperature and humidity, and increased dropout resulting from tape wear.
7-3 TEST CONDITIONS↑ TOP
The test conditions specified in the following steps are to be met prior to performing the tests.
After these test conditions are met, continue with the following procedures for checking overall signal-to-noise, overall distortion, crosstalk, erasure, tape speed and flutter.
- Clean and demagnetize the heads.
- Use high quality low-noise tape such as Ampex 406, 407, 456, or Scotch 206, 207, 226, 246, 250, or an equivalent, and bulk erased to tape.
- Turn the power on and allow the unit to warm up for 20 minutes.
- Be sure the head cover is installed for all tests.
7-4 PERFORMANCE TESTS↑ TOP
Before performance testing, line input level check, line output level check, reproduce frequency response check, record level check, an overall frequency response check, and a SEL/REP level check are necessary.
Refer to Section 7-6, ELECTRONIC ALIGNMENT, in this manual for checking procedures.
For performance testing, at first proceed as follows. Demagnetize and clean the heads and all guiding component.
- Set the REEL switch to the appropriate position.
- Set the LINE OUTPUT LEVEL switches located on the REC/REP Amp. P.C. Board to "H" (has been set at the factory as standard), set each READY/SAFE pushbutton switch to the "OUT" SAFE position, and select INPUT of the MONITOR SELECT pushbutton switches.
- Thread a reel of bulk-erased tape onto the transport, and push the PITCH CONTROL knob to its fixed position.
7-4-(1) OVERALL SIGNAL-TO-NOISE↑ TOP
The overall signal-to-noise test requires an ASA "A" weighted filter for weighted measurement and a noise filter for unweighted measurement to eliminate noise outside the audible frequency band.
The filter should be built into a small aluminum box and its circuit is shown in Figure 7-1.
 ⤢ zoomTwo circuit schematics side by side: an ASA "A" curve filter for weighted measurement and a noise filter for unweighted measurement, each with input and output leads to an ac voltmeter.
Figure 7-1 Filter Schematics
The signal-to-noise test ratio depends on reproduce equalization, bias calibration, and record equalization.
Proceed as follows:
- Connect the filter to CH-1 LINE OUT and connect an ac voltmeter to the output of the filter.
- Depress the REPRO pushbutton switch of MONITOR SELECT, and set the CH-1 LINE INPUT control to its full clockwise position. Reset the TAPE TIMER to "0:00:00".
- Start the record mode and record for one minute. Rewind the tape to the "0:00:00" indication on the TIMER.
- Reproduce the recorded portion and read the noise level on the ac voltmeter.
- The S/N ratio is calculated by adding +4 dB standard level to the indication of the ac voltmeter, and an extra 12.4 dB for NAB equalizer or 11.2 dB for IEC equalizer. [Peak record level (1040 nWb/m) is +12.4 dB over 0 VU for NAB (250 nWb/m), and +11.2dB over 0 VU for IEC (320 nWb/m).]
- Repeat steps 1 through 4 for the other channels as required, and change the tape speed to check all signal-to-noise ratios.
Table 7-1 Signal-to-noise Specifications
| EQ | NAB | IEC | ||
|---|---|---|---|---|
| Tape Speed | Weighted | Unweighted | Weighted | Unweighted |
| 15 ips | 71 dB | 69 dB | 71 dB | 69 dB |
| 7.5 ips | 71 dB | 69 dB | 71 dB | 69 dB |
If signal-to-noise specifications are not met, check and adjust the following items.
- LINE OUTPUT LEVEL switch position.
- RECORD BIAS adjustment.
- Reproduce equalization.
- Record equalization.
- Record and/or reproduce electronics.
- Head magnetization.
- Magnetic flux from a motor, a soldering iron or a transformer near the recorder.
7-4-(2) OVERALL DISTORTION TEST↑ TOP
For an accurate distortion check, it is necessary to use an audio oscillator with less than 0.1% distortion and a wave analyzer with an adjustable bandwidth capability.
A wave analyzer with too narrow bandwidth may make it difficult to measure harmonics due to flutter components of the transport.
Measured total harmonic distortion will be affected by tape and modulation noise in addition to harmonic distortion.
To measure overall harmonic distortion, proceed as follows:
- Connect a wave analyzer to CH-1 LINE OUTPUT and connect an audio oscillator to CH-1 LINE INPUT.
- Depress the REPRO pushbutton switch of MONITOR SELECT, set the audio oscillator frequency to 1000 Hz.
- Set the wave analyzer frequency to 1000 Hz, the bandwidtn to 100 Hz, and the mode selector switch to AFC.
- Start the record mode and adjust the CH-1 LINE INPUT control for a 0 VU reading on the VU meter.
- Adjust the fine tuning control and input level control on the wave analyzer for a full scale reading of 100%.
- Change the wave analyzer tuning control to 2000 Hz and measure the second harmonic content. The second harmonic content should not exceed 0.1%.
- Change the wave analyzer tuning control to 3000 Hz and measure the third harmonic content. Third harmonic distortion is dependent upon the type of tape used, and the accuracy of the RECORD BIAS setting. A typical reading for low noise high output tape is 0.4%.
If distortion specifications are not met, check and adjust the following items.
- RECORD BIAS adjustment.
- Head magnetization.
- Record and/or reproduce electronics.
7-4-(3) CROSSTALK TEST↑ TOP
It is important tnat blank bulk-erased tape be used for the crosstalk test.
To measure crosstalk of adjacent channels, proceed as follows:
- Follow the procedure in the Overall Distortion test, perform steps 1 through 5.
- Connect a wave analyzer from the output of CH-1 to CH-2 LINE OUTPUT.
- Measure tne crosstalk in dB. Crosstalk should not exceed 60 dB.
- Repeat steps 1 through 3 for the other channels as required.
If crosstalk specifications are not met, record and reproduce head alignment (height and tape contact) are incorrect or the record or reproduce head is defective.
7-4-(4) ERASURE TEST↑ TOP
It is important that blank bulk-erased tape be used in the erasure test.
To measure depth of erase, proceed as follows:
- Follow the procedure in the Overall Distortion Test, perform steps 1 through 5. A 1000 Hz signal is being recorded at SRL (0 VU).
- Adjust the LINE INPUT control for a 1000 Hz signal being recorded at 10 dB (+10 VU) above SRL. Continue recording for a few minutes.
- Disconnect the audio oscillator.
- Rewind and reproduce the recorded section. Check and readjust controls of the wave analyzer as necessary for a full scale reading of 100%.
- Press the RECORD pushbutton to place the recorder in the record mode. As the tape is being erased, adjust the percent scale on the wave analyzer to read the residual 1000 Hz tone.
- Repeat tne same procedure for tne other channels.
- The depth of erase should be more than 70 dB.
If erasure specifications are not met, check and adjust the following items.
- Erase and/or record head alignment, (height, tape contact).
- Erase head wear.
- Erase head surface cleanliness.
- Bias oscillator adjustment.
7-4-(5) TAPE SPEED MEASUREMENT↑ TOP
A flutter test tape is used for measuring tape speed.
Since tape tension affects tape speed, it is important for accurate measurement that tne flutter test tape used is attached to the end of a full wound reel of blank tape as shown in Figure 7-2, and is used with tne REEL pushbutton set to the appropriate reel size.
Clean heads, capstan shaft, pinch roller, and all tape guiding components in the tape path before measurement.
Proceed as follows:
- Place the PITCH CONTROL in the fixed position and set the READY/SAFE pushbutton switches of all channels to the "SAFE" position.
- Connect a flutter meter with a frequency counter to the LINE OUT and press "REPRO" of tne MONITOR SELECT pushbutton switches.
- Set the SPEED switch to "OUT" HIGH position and use the test tape at 15 ips.
- Attach the test tape to a 10 1/2 inch NAB reel as shown in Figure 7-2, place the test tape on the supply reel table, thread the tape, and set the REEL switch to the "OUT" LARGE position.
- Place the recorder in the play mode and note the reading on the frequency counter. The reading should be between 2994 and 3006 Hz (3000Hz±0.2%).
- Repeat the procedure at a point towards the end of the reel, and for 7 1/2 ips.
- If adjustment is necessary, refer to Section 6-4.
If speed accuracy is not within ±0.2%, check and adjust the following items.
- Pinch roller tire wear and pressure.
- Brakeshoe for brake drum contact.
- Power correctness.
- Pinch roller and capstan cleanliness.
- Tape Tension.
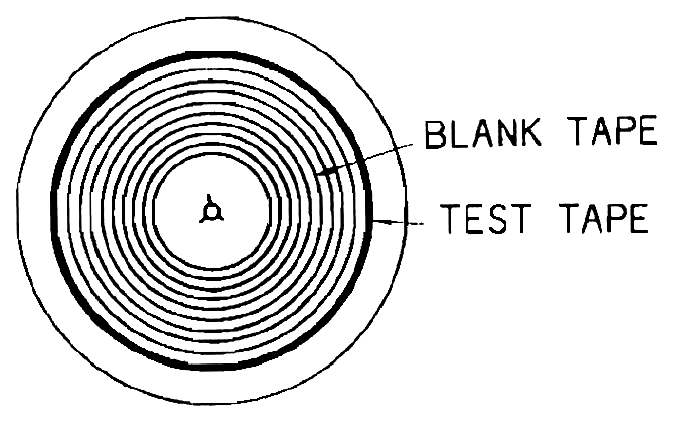 ⤢ zoomA tape reel viewed head-on, showing an outer wound band of blank tape and, closer to the hub, a narrower band of test tape spliced end to end with it, each leader labelled by a pointer.
Figure 7-2 Test Tape Loading
In addition, check the following items for the dc servo capstan motor.
- Servo control circuit.
- Capstan motor.
NOTE
To avoid a counting error due to the line frequency, it is recommended that tne time-base of the frequency counter be set to the crystal oscillator position.
7-4-(6) FLUTTER AND WOW TEST↑ TOP
It is recommended that these checks are made with standard flutter test tapes (See Table 4-2 ) which are recorded on precise equipment to produce less than 0.03% rms flutter.
After recording a section of tape, rewind to the beginning and start the tape in the reproduce mode.
Flutter meters are sensitive to amplitude modulation that results from poor head-to-tape contact or from signal dropout.
Therefore, clean the heads before making a flutter test.
The following method is used with a test tape:
It is important that tne flutter test tape used is attached to the end of a full wound reel of blank tape as shown in Figure 7-2, and is used with the REEL pushbutton set to the appropriate reel size.
- Place the PITCH CONTROL to the "IN" fixed position and set tne READY/SAFE pushbutton switches of all channels to the "SAFE" position.
- Connect a flutter meter to the LINE OUT of an inner track channel and press "REPRO" of the MONITOR SELECT pushbutton switches.
- Set the selector switch of the flutter meter to the NAB weighted position, set the SPEED switch to HI, and use the test tape at 15 ips.
- Attach the test tape to a 10 1/2 inch NAB reel as shown in Figure 7-2, place the test tape on the supply reel table, thread the tape, and set the REEL switch to the "OUT" LARGE position.
- Place the recorder in the play mode and note the reading on the flutter meter. The reading should be as shown in Table 7-2.
- Repeat the procedure at a point towards the end of the reel, and for 7 1/2 ips.
The following method is used when a test tape is not available:
- Connect the oscillator signal output (3 KHz) of the flutter meter to an inner cnannel (not an edge channel) LINE INPUT connector of the recorder.
- Connect the same channel's LINE OUTPUT connector of the recorder to the sigan l input of the flutter meter.
- Set the SPEED switch to "OUT" HIGH, press REPRO of the MONITOR SELECT pushbutton switches, start the record mode, and adjust the appropriate LINE INPUT control.
- Rewind and reproduce the recorded portion, and note the flutter and wow on the flutter meter.
- Check the flutter and wow at a low tape speed, and check it at a point towards the end of the reel.
Table 7-2 Flutter and Wow Specification
| Tape speed | Flutter and wow |
|---|---|
| 15 ips | 0.05% |
| 7.5 ips | 0.06% |
Flutter and wow can be caused by any element in the tape path.
Excessive flutter and wow may be traced by observing the flutter component on an oscilloscope screen connected to the demodulator output of the flutter meter.
If the fluctuation rate observed on the oscilloscope coincides with the rotational elements, such as the supply or takeup reel, capstan or pinch roller, the problem source may be easily traced.
Other sources of excessive flutter and wow are:
- Defective capstan servo control.
- Damaged capstan motor.
- Capstan needs lubrication (dry sleeve bearing).
- Brakeshoe is contacting brake drum.
- Defective tape reels or tape.
- Pinch roller tire is worn or has insufficient pressure, or the plunger of the pinch roller solenoid does not reach its bottom.
- Dirty pinch roller and capstan.
7-5 ACCESS TO ELECTRONICS ASSEMBLY↑ TOP
The record/reproduce electronics assembly can easily be opened for adjustment.
To gain access to the electronics assembly, proceed as follows.
- Remove four screws on the electronics top panel as shown in Figure 7-3.
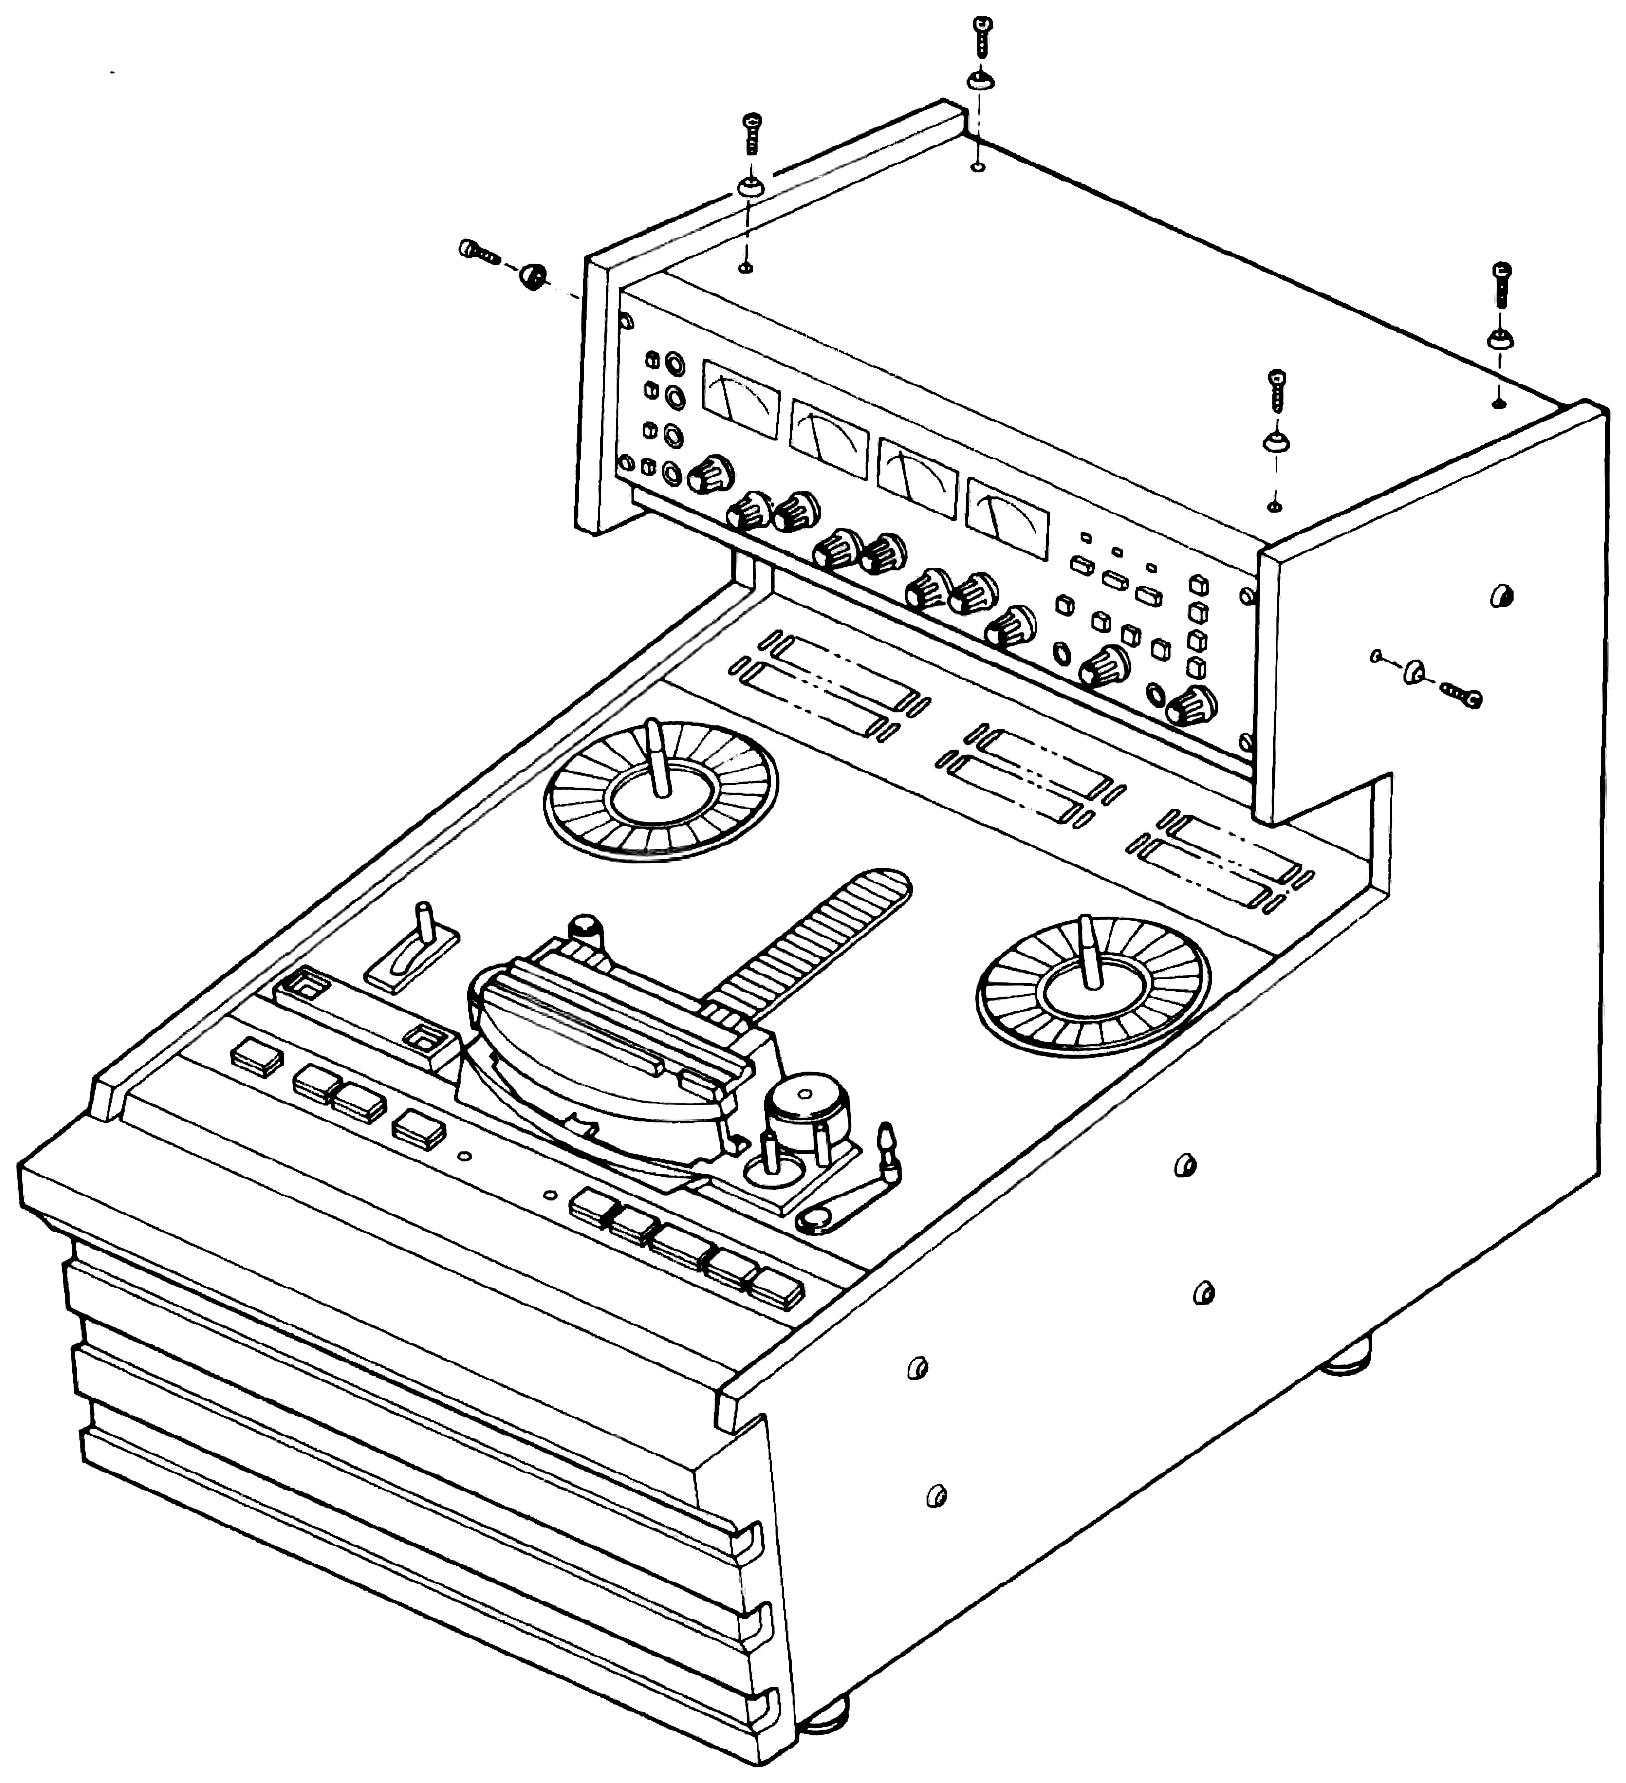 ⤢ zoomAn isometric view of the recorder's electronics top panel raised open on its hinge, with the four mounting screws called out around its edges.
Figure 7-3 Electronics Access
7-6 ELECTRONIC ALIGNMENT↑ TOP
If the previous performance tests were not successful, perform the following applicable reproduce, record, and bias amplifier alignment procedures.
7-6-(1) REPRODUCE SYSTEM↑ TOP
Reproduce system alignments consist of reproduce head azimuth adjustment, frequency response adjustment, SRL (REPRO level) adjustment and SEL/REP. level adjustment.
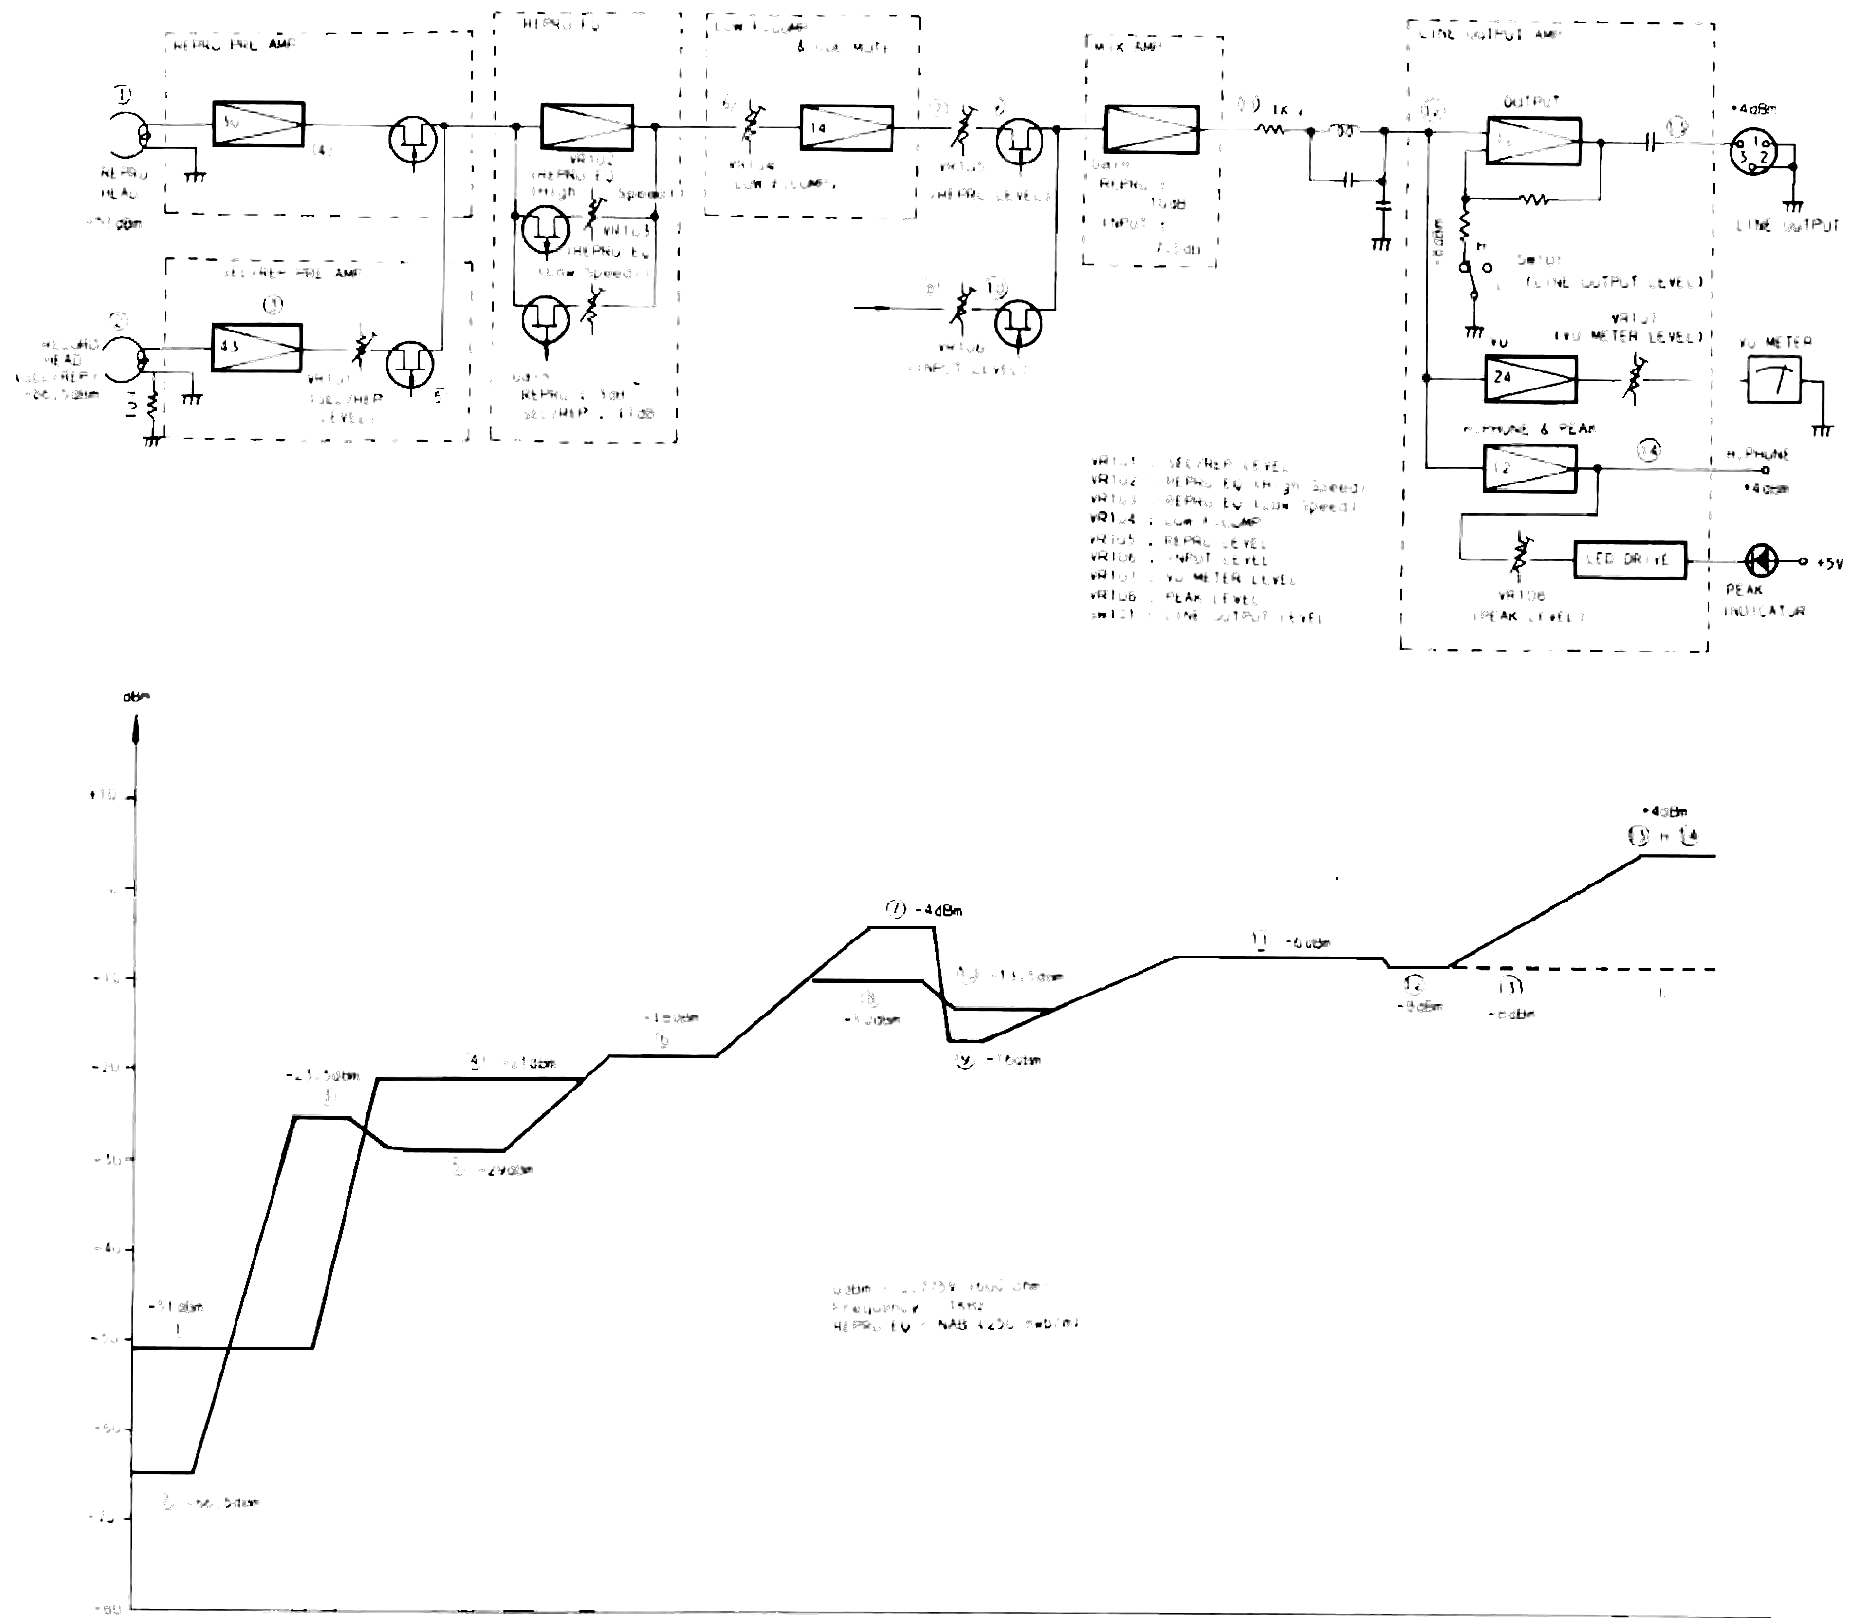 ⤢ zoomA block diagram of the reproduce signal path from the reproduce and SEL/REP heads through the preamps, EQ, low-frequency compensation, mix and line output stages to the outputs, with a stacked dBm level chart plotting the signal level at each numbered test point beneath it.
Figure 7-4 Reproduce System Block and Level Diagram
7-6-(2) REPRODUCE HEAD AZIMUTH ADJUSTMENT↑ TOP
Head azimuth adjustment should be made with a "LOW" tape speed (7 1/2 ips) for critical alignment.
Use the test tapes listed in Table 4-3.
- Thread a low speed test tape, depending on the equalization of the equipment, to the recorder.
- Connect the ac voltmeter to the LINE OUT connector.
- Reproduce the coarse azimuth adjustment signal (500 Hz at 7 1/2 ips) of tne test tape.
CAUTION
DO NOT ADJUST ANY OTHER SCREW EXCEPT THE AZIMUTH ADJUSTMENT SCREW (LABELED "A3" IN FIGURE 7-5).
- Then, reproduce the fine azimuth adjustment signal (16 KHz at 7 1/2 ips) and adjust the azimuth screw "A3" (nickel plated) for a maximum reading on the ac voltmeter.
- If a maximum reading cannot be achieved within one full turn of the azimuth screw, a full head alignment may be required. Refer to section 8 of this manual.
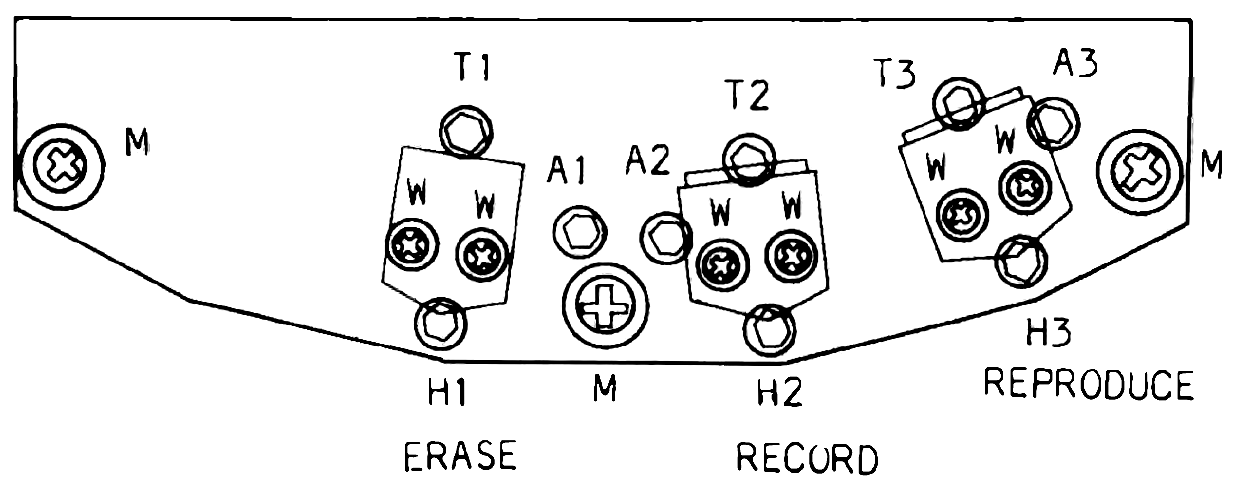 ⤢ zoomThe head panel's front edge with three head shoe assemblies labelled ERASE, RECORD and REPRODUCE, each with its mounting and azimuth screws called out as T1/A1/H1, T2/A2/H2 and T3/A3/H3.
Figure 7-5 Head Assembly
7-6-(3) FREQUENCY RESPONSE↑ TOP
Since the reproduce equalizer circuit has high frequency independent controls for both 15 ips and 7 1/2 ips, an adjustment is made at first for 15 ips.
Table 7-3 shows tne time constant and fluxivity at each equalizer.
- Connect the ac voltmeter to the LINE OUTPUT connector.
- Thread the test tape through the equipment. For 15 ips:
- Reproduce a 500 Hz signal on the test tape. At this time the value on the ac voltmeter is decided as standard.
- Reproduce the frequency response test signal (from 31.5 up to 20 KHz) and note the reading on the ac voltmeter.
- Adjust the VR 102 adjustment controls with a frequency of 10 KHz for a 0 dB reading on the ac voltmeter. The reading should be 31.5 Hz to 20 KHz ±2 dB. For 7 1/2 ips:
- Repeat steps 2 and 4 to at 7 1/2 ips tape speed.
- Adjust the VR 103 adjustment controls with a frequency of 10 KHz for a 0 dB reading on the ac voltmeter. The reading should be 31.5 Hz to 16 KHz ±2 dB.
- Repeat steps 1 through 7 for the other channels as required.
Table 7-3 Equalizer Time Constants & Fluxivity
| Equalization | Time Constants | Fluxivity |
|---|---|---|
| NAB 15 ips | 3180 + 50 µ sec | * 250 nWb/m |
| IEC 15 ips | ∞ + 35 µ sec | **320 nWb/m |
| NAB 7 1/2 ips | 3180 + 50 µ sec | * 250 nWb/m |
| IEC 7 1/2 ips | ∞ + 70 µ sec | **320 nWb/m |
* short circuit flux
** open circuit flux
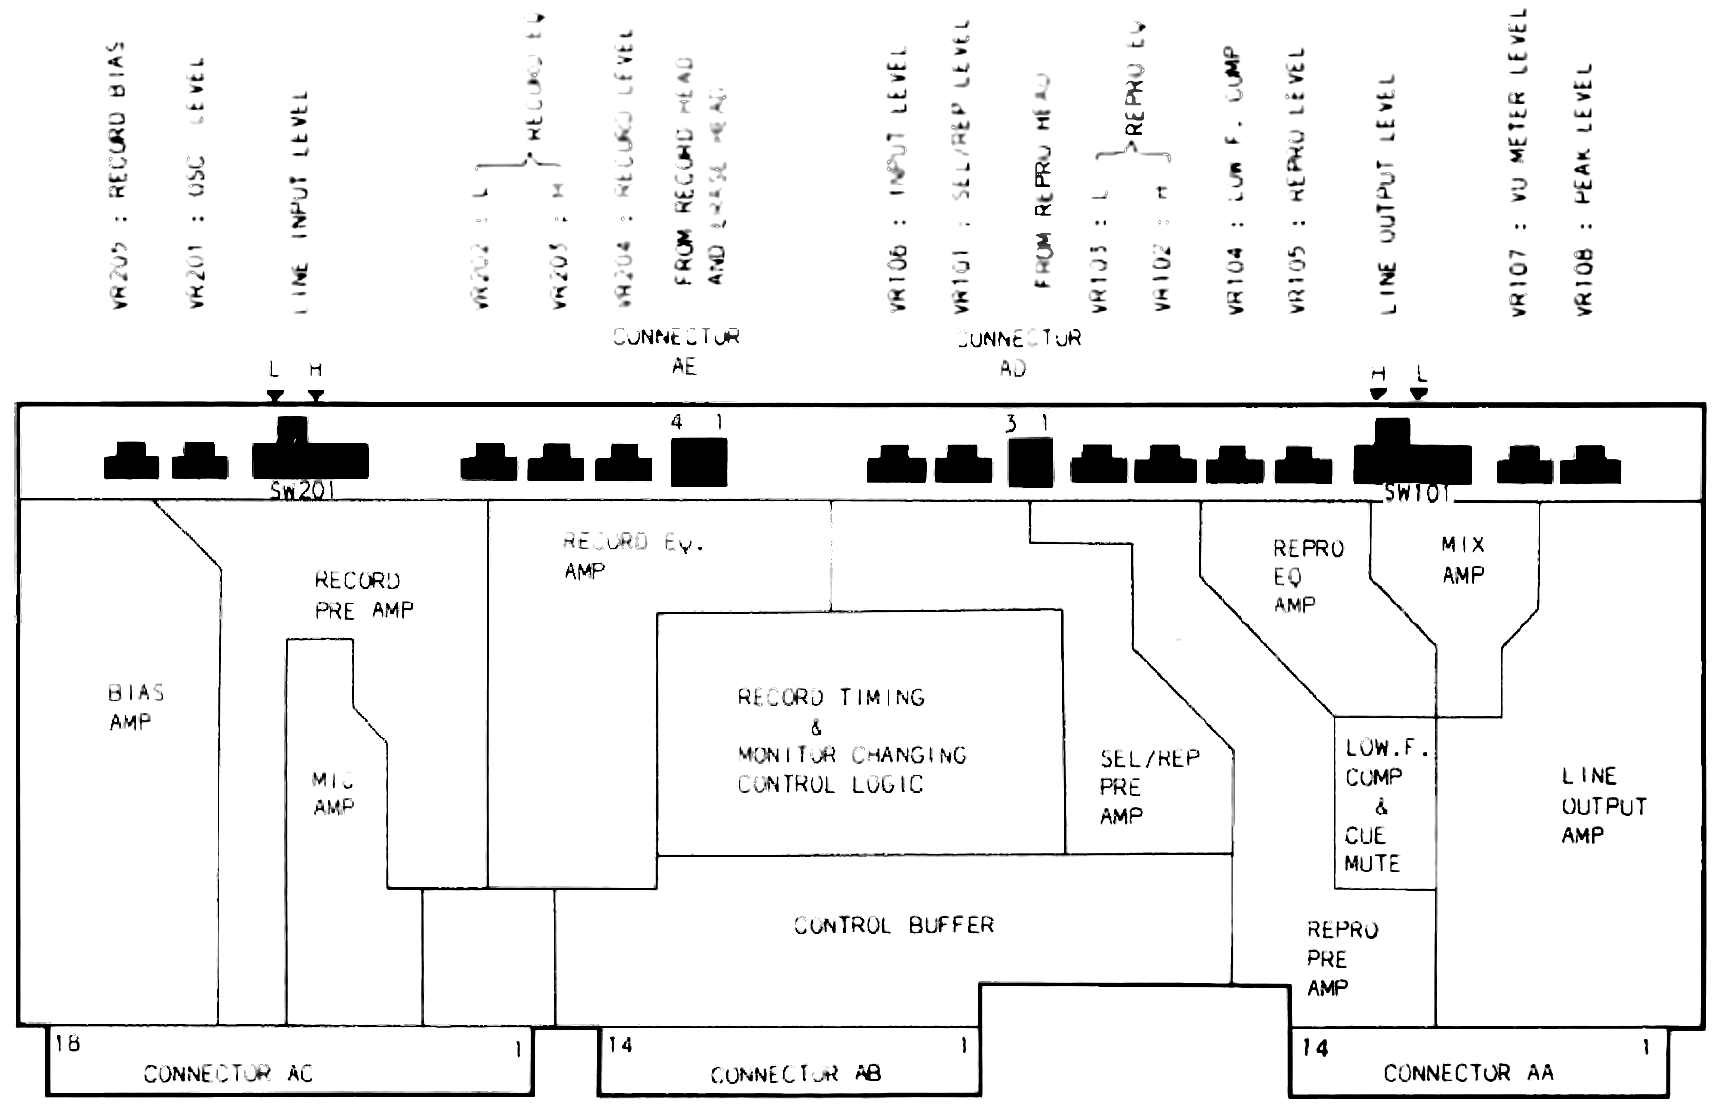 ⤢ zoomThe record/reproduce electronics board's component side, showing the row of trimmer potentiometers along the top edge with leader lines naming each by VR number and function, and the amplifier and control stages beneath.
Figure 7-6 Location of Record/Reproduce Electronics
7-6-(4) SRL (REPRO LEVEL) ADJUSTMENT↑ TOP
- Connect the ac voltmeter to the LINE OUTPUT connector.
- Thread the 15 ips test tape through the equipment.
- Reproduce the reference recorded flux on the test tape and adjust the VR 105 adjustment controls for a +4 dBm reading on the ac voltmeter, (LINE OUTPUT LEVEL switch is in "H" position).
7-6-(5) SEL/REP. LEVEL ADJUSTMENT↑ TOP
- Depress the SEL/REP pushbutton switch of MONITOR SELECT.
- Reproduce the reference recorded flux and adjust the VR 101 adjustment controls for a +4 dBm reading on the ac voltmeter.
7-6-(6) RECORD SYSTEM↑ TOP
Before performing record system adjustments, a reproduce system adjustment must be made.
7-6-(7) RECORD HEAD AZIMUTH ADJUSTMENT↑ TOP
The head azimuth may be adjusted at a low tape speed for critical head alignment and at 10 dB below the standard recording level.
- Connect the ac voltmeter to the LINE OUTPUT connector and connect the audio oscillator to the EXT OSC jack.
- Set the TEST OSC switch to the EXT OSC, the LINE OUTPUT LEVEL switch to the HIGH position, the LINE INPUT LEVEL switch to the LOW position, and depress the REPRO pushbutton switch of MONITOR SELECT.
- Thread a blank tape through the equipment.
- Set the audio oscillator frequency to 1 KHz.
- Place the equipment in the record/reproduce mode and adjust the LINE INPUT control for -6 dBm on the ac voltmeter.
- Adjust the record head azimuth screw "A2" for a maximum reading on the ac voltmeter at a frequency of 15 KHz for 7 1/2 ips record/reproduce mode.
CAUTION
DO NOT ADJUST ANY OTHER SCREW EXCEPT THE AZIMUTH ADJUSTMENT SCREW (LABELED "A2" IN FIGURE 7-5).
- If a maximum reading can not be achieved within one full turn of the azimuth screw, or a maximum reading on the ac voltmeter is well below -6 dBm, a full head alignment may be required. Refer to section 8 of this manual.
7-6-(8) RECORD BIAS ADJUSTMENT↑ TOP
Figure 7-7 shows the variation of the frequency response by the bias set, the RECORD EQ, and low frequency compensation adjustment control.
Figure 7-9 shows the characteristics of the bias current v.s. output and distortion of scotch #226 tape.
The record bias should be set at 3 dB over bias at 10 KHz for low distortion and high maximum output level (MOL).
The overall frequency response may be adjusted with both the RECORD EQ, the RECORD BIAS, and LOW F. COMP .adjustment controls for a flat frequency response curve.
- Set the tape speed to 15 ips, and depress the REPRO pushbutton switch of MONITOR SELECT. BIAS ADJUSTMENT AT 10 KHz
- Record and reproduce the 10 KHz signal of the TEST OSC and adjust the LINE INPUT control for a +4 dBm reading on the ac voltmeter.
- Adjust the RECORD BIAS adjustment controls (VR 205) for a peak indication on the ac voltmeter and then turn the RECORD BIAS adjustment controls clockwise until a decreased level of 3.0 dB is obtained. The standard biasing point of the MX-5050 MK III -4 is at 3.0 dB overbias at 10 KHz for 15 ips.
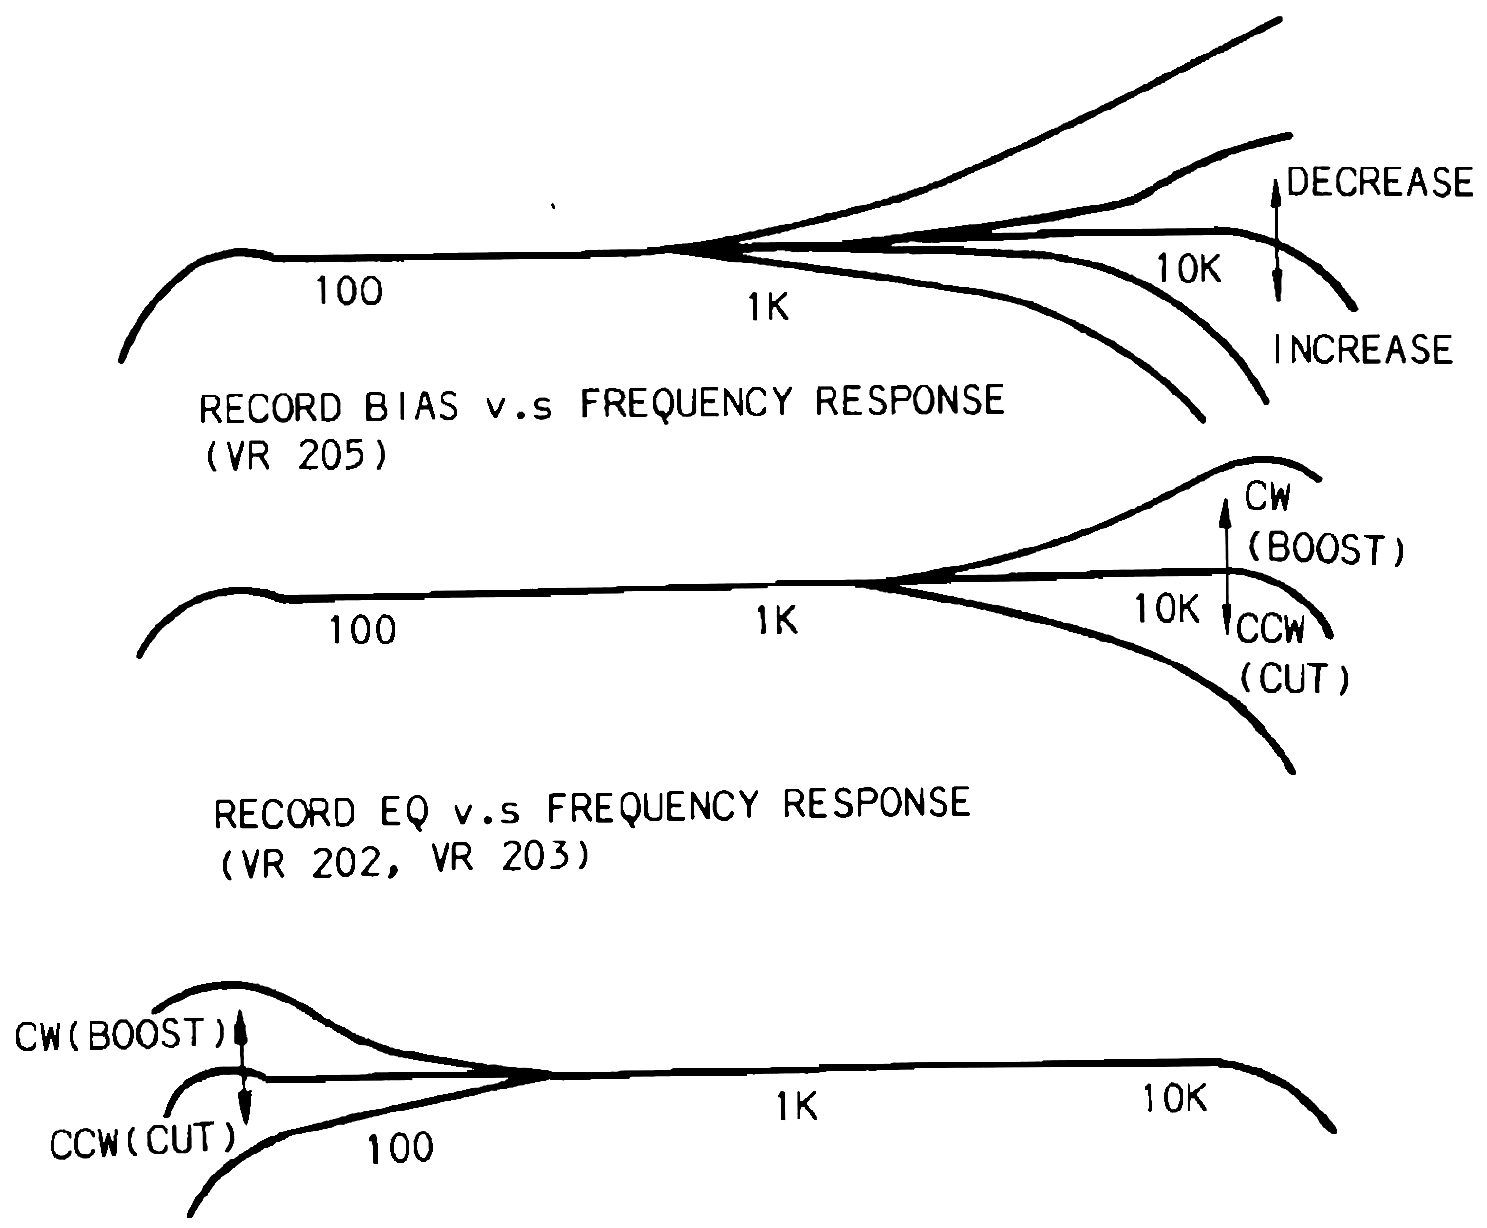 ⤢ zoomThree stacked frequency-response curve graphs plotted against frequency from 100 Hz to 10 KHz or 20 KHz: record bias v.s. frequency response, record EQ v.s. frequency response, and low frequency compensation v.s. frequency response, each with boost/cut or increase/decrease arrows beside its curves.
Figure 7-7 Overall Frequency Response
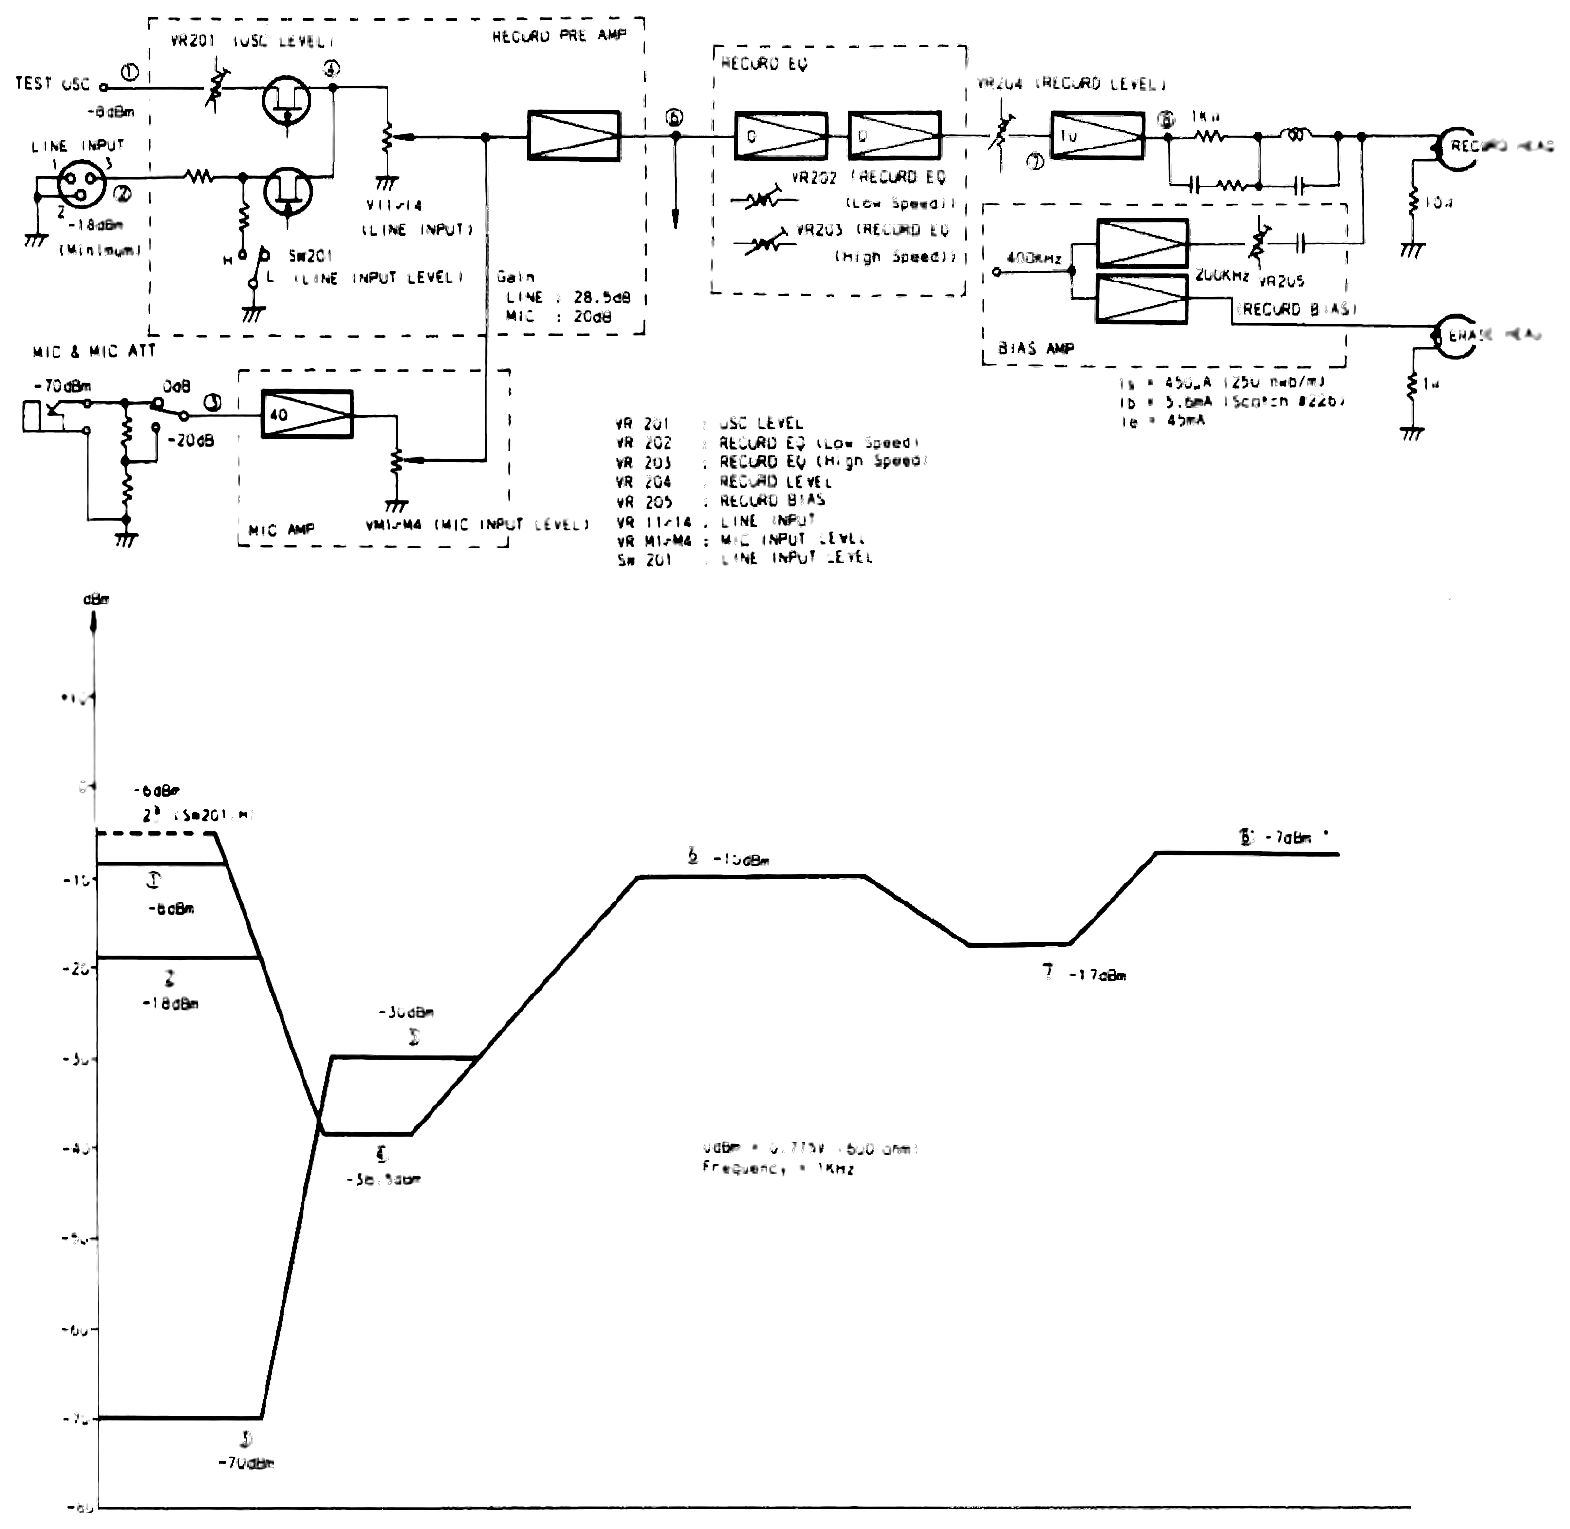 ⤢ zoomA block diagram of the record signal path from the line, mic and test-oscillator inputs through the record preamp, EQ and bias amp stages to the record and erase heads, with a stacked dBm level chart plotting the signal level at each numbered test point beneath it.
Figure 7-8 Record System Block and Level Diagram
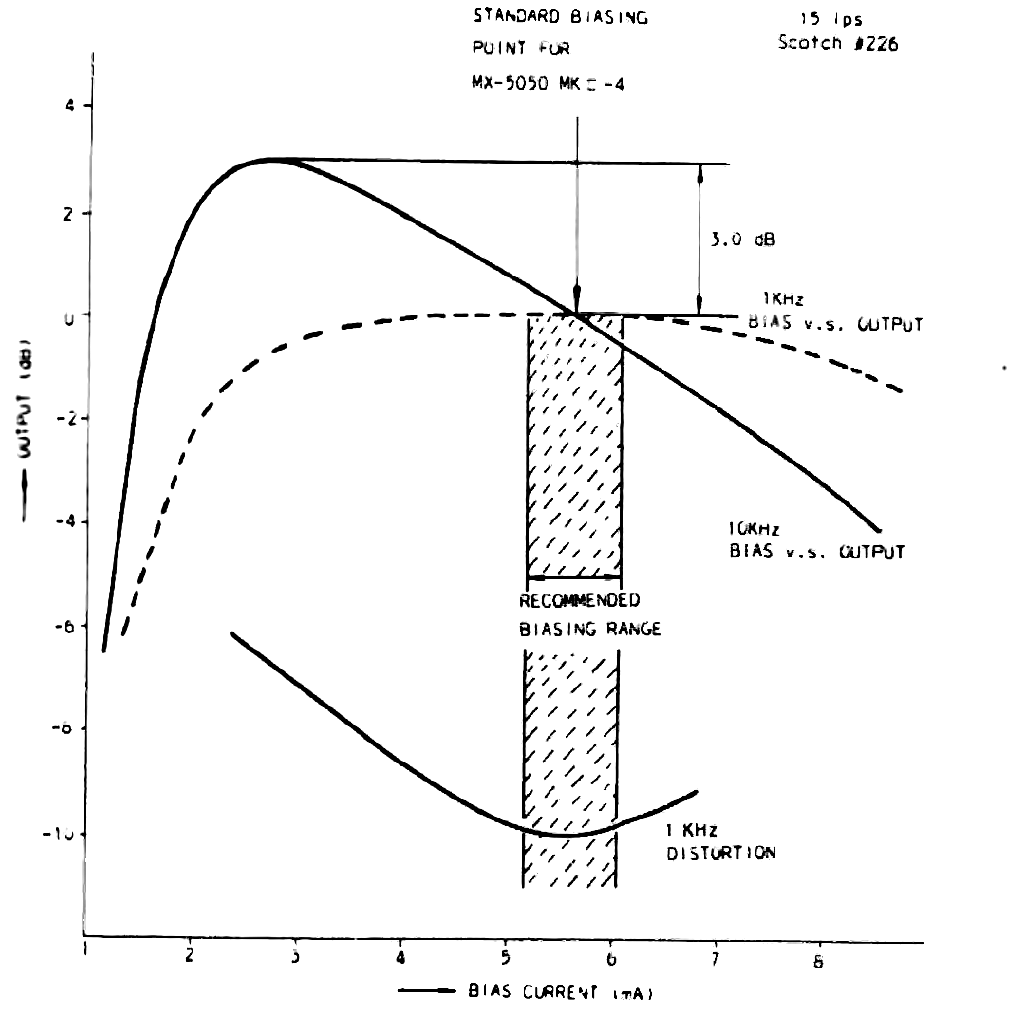 ⤢ zoomA bias-current curve chart plotting output in dB against bias current in mA, with 1 KHz and 10 KHz bias v.s. output curves, a 1 KHz distortion curve, and a shaded recommended biasing range column marking the standard biasing point for the MX-5050 MK III-4 at 15 ips with Scotch #226 tape.
Figure 7-9 Bias Current v.s. Output and Distortion
NOTE
*1: 320 nwb/m : DIN REFERENCE LEVEL This is "open circuit flux" and corresponds of 290 nwb/m of "short circuit flux".
*2: 250 nwb/m, 185 nwb/m These are "short circuit flux".
*3: 1040 nwb/m : Reference level for signal to noise ratio measurement and trigger level for peak indicator.
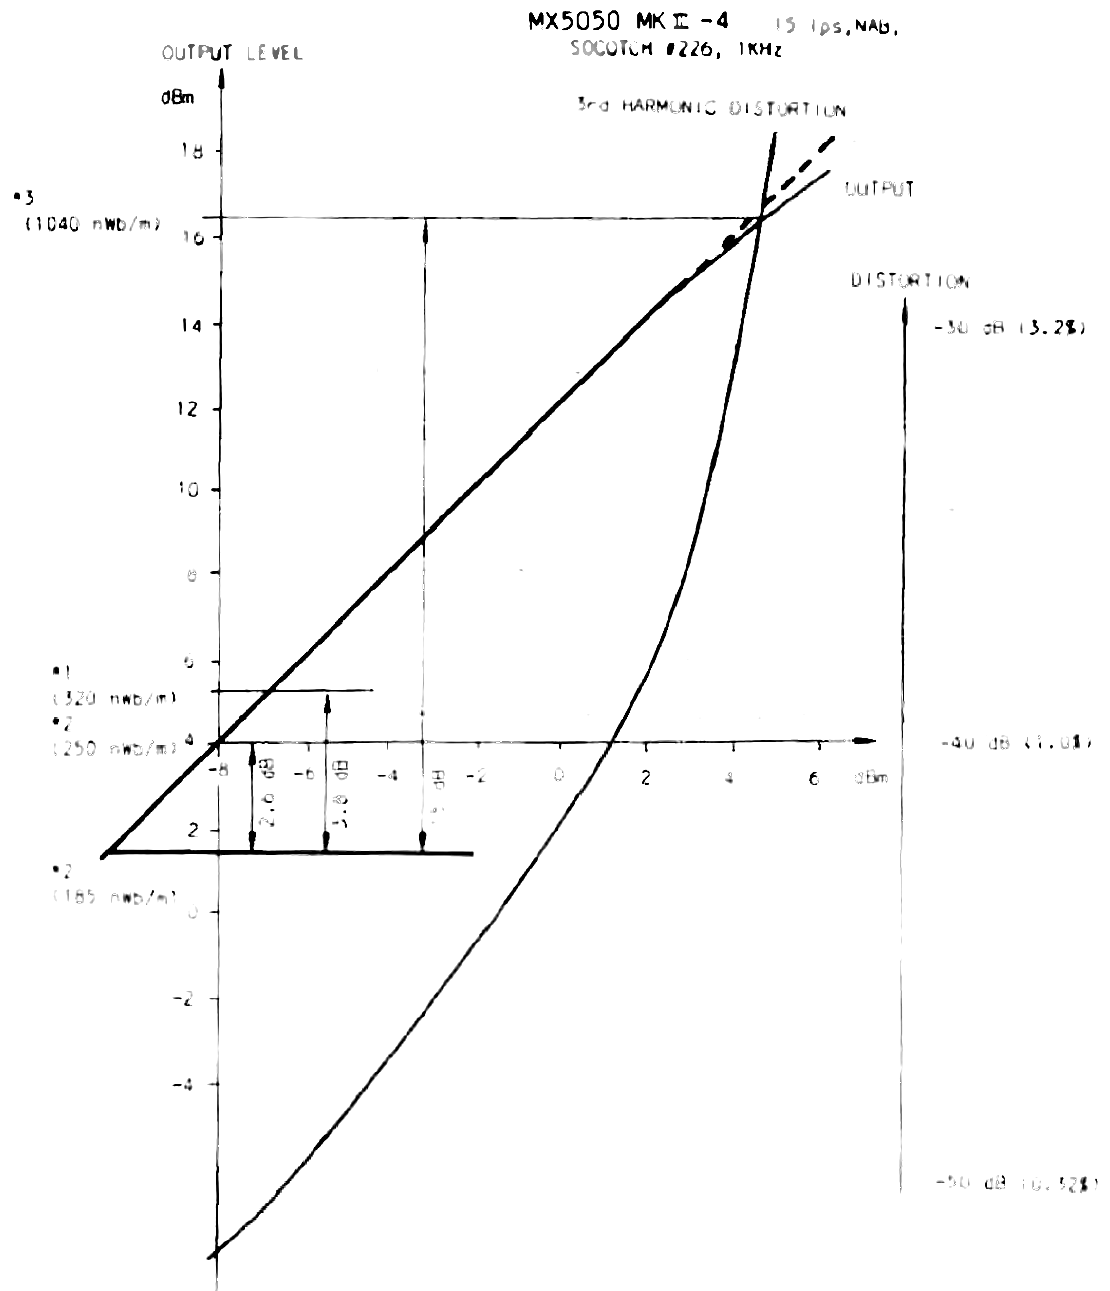 ⤢ zoomAn input/output level and distortion curve chart plotting output level in dBm and third-harmonic distortion in dB against input level in dBm, with reference points at *1, *2 and *3 marked on the input axis.
Figure 7-10 Input v.s. Output and Distortion
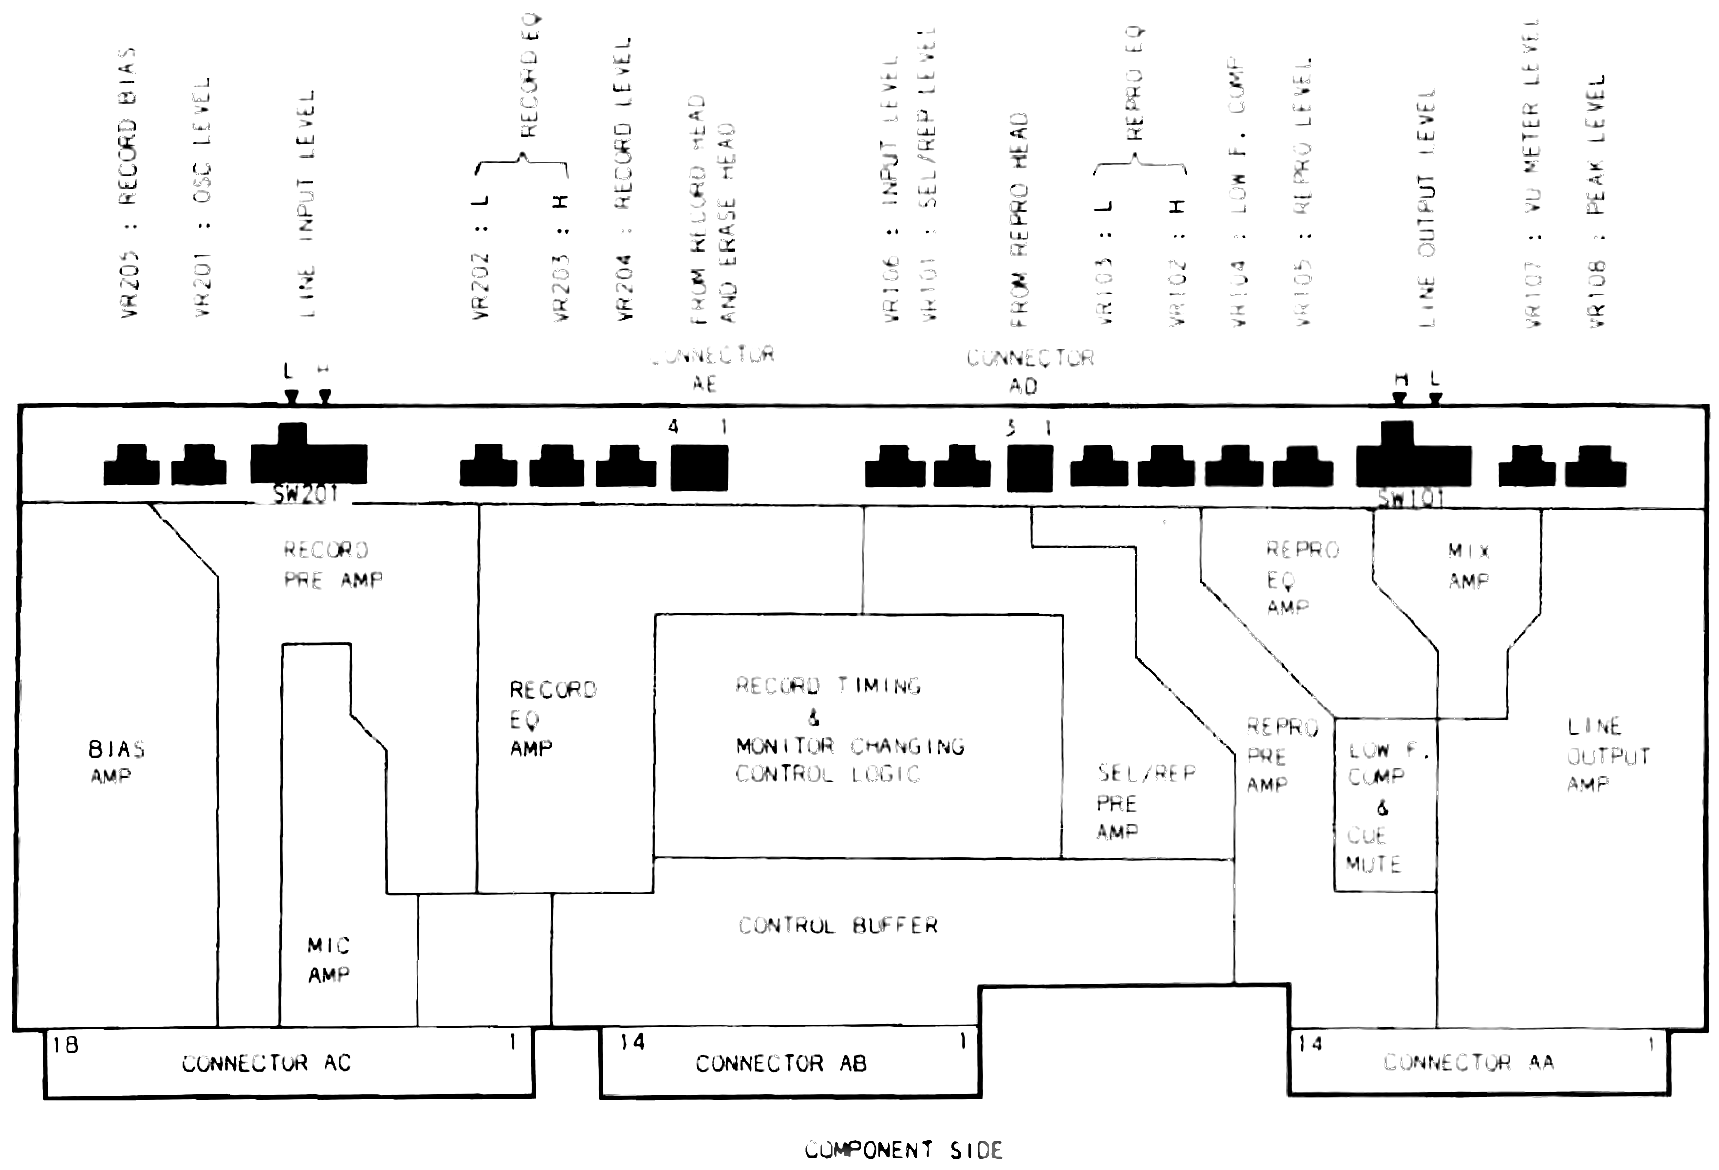 ⤢ zoomThe record/reproduce electronics board's component side, showing the row of trimmer potentiometers along the top edge with leader lines naming each by VR number and function, and the amplifier and control stages beneath.
Figure 7-11 Location of Record/Reproduce Electronics
7-6-(9) OVERALL FREQUENCY RESPONSE↑ TOP
At 15 ips, overall frequency response is measured at SRL (0 VU), and at 7 1/2 ips, it should be measured at least 10 dB (-10 VU) below SRL.
The overall frequency response is affected by the biasing.
Refer to 7-6-(8) RECORD BIAS ADJUSTMENT to adjust the record biasing.
RECORD EQUALIZER adjustment controls HIGH (VR 203) and LOW (VR 202) relate to the HIGH and LOW of the SPEED switch.
- Connect the audio oscillator to the EXT OSC jack. Set the TEST OSC switch to the EXT OSC, and connect the ac voltmeter to LINE OUTPUT.
- Depress tne REPRO pushbutton switch of MONITOR SELECT, and place the LINE OUTPUT LEVEL switch in the HIGH position.
- Place the equipment in the record mode. For 15 ips:
- Feed a 1 KHz signal, and adjust the LINE INPUT control to obtain +4 dBm reading on the ac voltmeter.
- Shift the frequency to 10 KHz and adjust the RECORD EQ HIGH adjustment controls (VR 203) to obtain a +4 dBm reading on the ac voltmeter.
- Shift the frequency to 100 Hz and adjust the LOW F. COMP. (Low Frequency Compensation) adjustment controls (VR 104) to obtain a +4 dBm reading on the ac voltmeter.
- Vary the frequency from 40 Hz to 20 KHz and confirm that the frequency response is within tne specifications. The frequency response specification should be 40 Hz to 20 KHz ±2 dB. For 7 1/2 ips:
- Shift the frequency to 1 KHz and adjust the LINE INPUT control to obtain a -6 dBm (-10 VU) reading on the ac voltmeter with the record mode.
- Shift the frequency to 10 KHz and adjust the RECORD EQ. LOW adjustment controls (VR 202) to obtain a -5.5 dBm reading on the ac voltmeter.
- Vary the frequency from 30 Hz to 18 KHz and confirm that the frequency response is within the specifications. The frequency response specification should be 30 Hz to 18 KHz ±2 dB.
NOTE
If the specified frequency response characteristics were not obtained in the above procedures, adjust the record biasing within the recommended biasing range (from 2.5 dB to 3.5 dB over bias at 10 KHz).
7-6-(10) MONITOR INPUT LEVEL and VU METER LEVEL ADJUSTMENT↑ TOP
- Connect the audio oscillator to the EXT OSC jack and set the TEST OSC switch to the EXT OSC, and feed a 1 KHz for a -18 dBm signal.
- Depress the INPUT pushbutton switch of MONITOR SELECT and place the LINE INPUT LEVEL switch in the LOW position, and turn the LINE INPUT controls fully clockwise.
- Adjust the VR 106 to obtain a +4 dBm reading on the ac voltmeters.
- Then, adjust the VR 107 to obtain a 0 dB indication on the VU meters.
- Verify that the values shown in Table 7-4 are obtained on each "H" and "L" position of the LINE INPUT LEVEL switch and LINE OUTPUT LEVEL switch.
Table 7-4 Standard Level
| Minimum INPUT | VU Meter | OUTPUT | ||||
|---|---|---|---|---|---|---|
| SW | H | -6 dBm | 0 dB | SW | H | +4 dBm |
| 201 | L | -18 dBm | (0 VU) | 101 | L | -8 dBm |
SW101: LINE OUTPUT LEVEL Switch
SW201: LINE INPUT LEVEL Switch
7-6-(11) TEST OSC LEVEL ADJUSTMENT↑ TOP
Before making this adjustment, the monitor input level adjustment snould be completed.
- Shift the audio oscillator 1 KHz level to -8 dBm and adjust the LINE INPUT controls for a 0 dB indication on the VU meter.
- Set the TEST OSC switch to the 1 K position and adjust TEST OSC LEVEL adjustment control (VR 201) for 0 dB on the VU meter.
- Set the TEST OSC switch to the 10 K position and adjust VR 501 on the Amplifier Control P.C.B.(shown in Figure 7-12) for 0 dB on the VU meter.
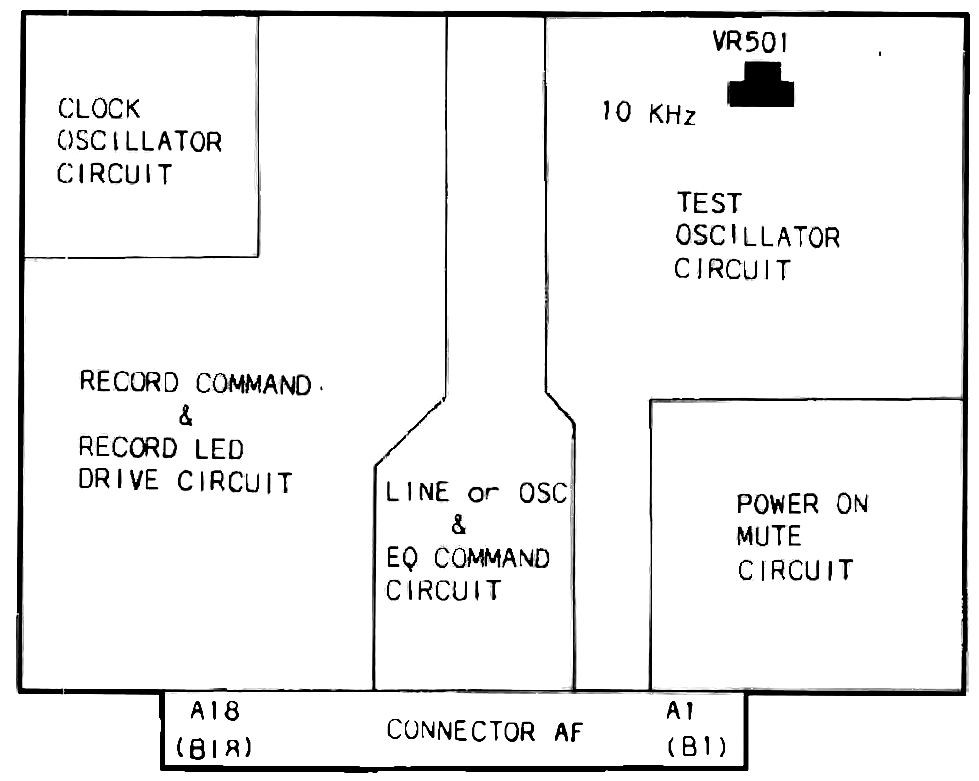 ⤢ zoomThe amplifier control P.C. board's component side, showing the clock oscillator, test oscillator, line/OSC and EQ command, record command and LED drive, and power-on-mute circuit blocks with the VR501 trimmer called out near the 10 KHz label.
Figure 7-12 Location of AMP. Control Electronics
7-6-(12) RECORD LEVEL ADJUSTMENT↑ TOP
A record level adjustment should be made whenever the tape used with the equipment Is changed and the head is replaced.
- Set the SPEED selector switch to HIGH and depress the INPUT pushbutton switch of MONITOR SELECT.
- Set the TEST OSC switch to 1 KHz and adjust the LINE INPUT controls to obtain a 0 dB indication on the VU meter.
- Depress the REPRO pushbutton switch of MONITOR SELECT and place the equipment In the record mode.
- Adjust the RECORD LEVEL adjustment controls (VR 204) to obtain a 0 dB indication on the VU meter (record/reproduce output level).
7-6-(13) PEAK INDICATOR TRIGGER LEVEL ADJUSTMENT↑ TOP
Peak Indicators are triggered at the recorded flux level of 1040 nWb/m.
This point is 15 dB above 185 nWb/m, 12.4 dB above 250 nWb/m, and 11.2 dB above 320 nWb/m as shown in Figure 7-10.
- Set the LINE INPUT LEVEL switch to the "L" position, the LINE OUTPUT LEVEL switch to the "H" position, TEST OSC switch to the LINE position, connect the audio oscillator to the EXT OSC jack. Set the TEST OSC switch to the EXT OSC, and feed a -8 dBm 1 KHz signal.
- Depress the INPUT pushbutton switch of MONITOR SELECT and adjust the LINE INPUT controls for a 0 dB indication on the VU meter.
- For NAB equalization, shift the feeding level of the audio oscillator to +4.4 dBm.
- For IEC equalization, shift the feeding level of the audio oscillator to +3.2 dBm.
- Turn the VR 108 adjustment controls fully counterclockwise and then clockwise until each peak indicator in the VU meter illuminates.